
Visual Misinformation
Challenge
A research group at the University of Washington’s Center for an Informed Public needed to develop a novel network visualization to express the spread of visual misinformation across different social media platforms during the November 2022 US midterm elections.
Role
I led metadata design and validation on a team of 3 other researchers skilled in quantitative research and computer science methodologies.
Solution
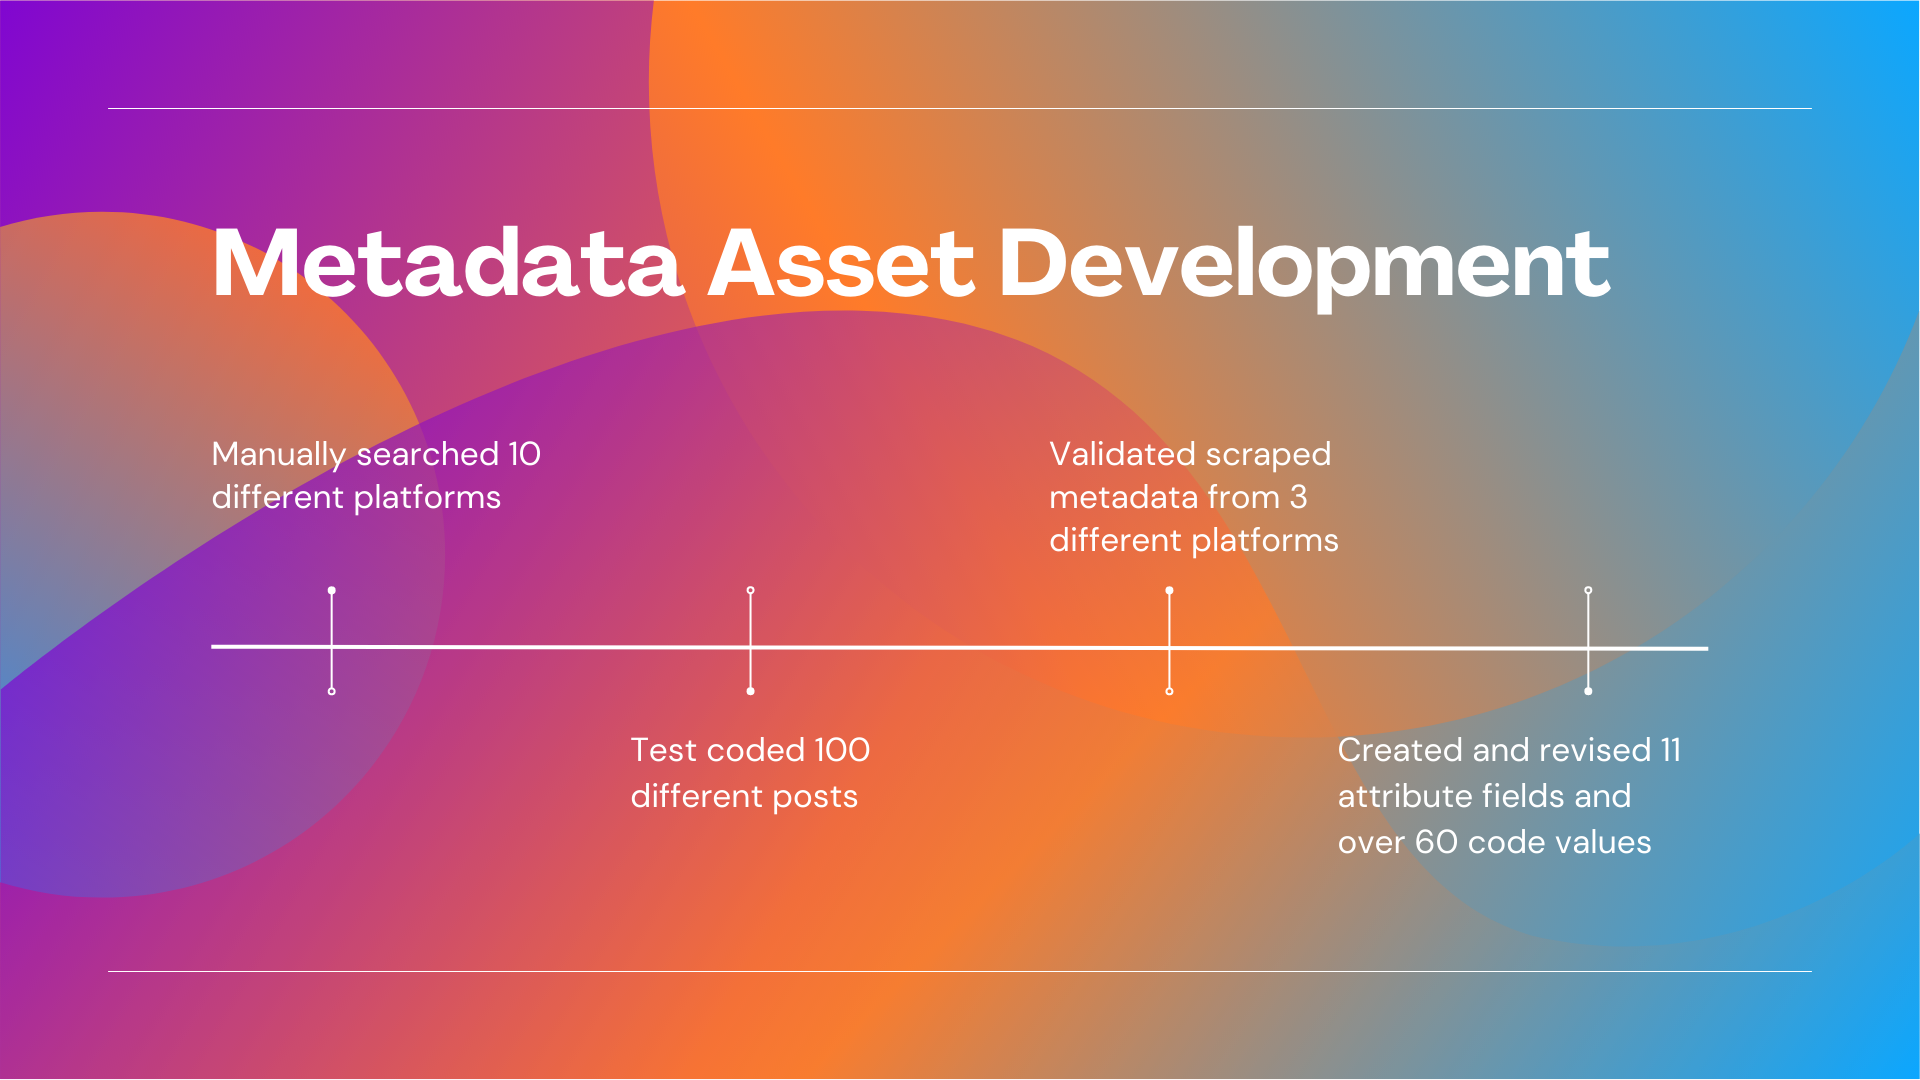
Across the span of 10 weeks, I manually searched over 10 different platforms and test coded over 100 different social media posts to create and to iteratively refine the codebook. Once a team member alerted me that the data pipeline had begun scraping post metadata at scale, I began using these data points to refine the codebook schema. To support testing by myself and other group members, I also edited the App Script within Google Sheets to support multiple-select dropdown menus for the most efficient coding experience. The final version of the codebook contains 11 different attribute fields and over 50 different code values.

Impact
I successfully translated the qualitative evaluation needs of the research group into a metadata schema with a comprehensive controlled vocabulary. This codebook will be used to code over 2000 posts, and to create a network visualization describing the spread of different kinds of content related to Lindell’s misinformation campaign across multiple social media platforms. This is a novel undertaking within the myriad disciplines of social computing, as previous work has focused on single platforms, and the domain of visual misinformation itself is still emerging among academic researchers.